Detection of process deviations with SPC methods
Respond to process changes in a timely manner and identify systematic influences in manufacturing support before rejects occur
Statistical Process Control (SPC) offers comprehensive manufacturing support with digital connection to processes and manufacturing stations as well as automatic testing machines and measuring equipment. Use analyses with Link into capacity and production planning. Use standardized evaluation methods and control charts to prove your normative requirements. The knowledge gained from your process data flows into continuous improvement management. For example, use the 5S method to evaluate workplace organization. Extensive analysis options show you trends and potential for improvement.
Online SPC monitoring in live evaluation (for application)
How do you ensure that violations of intervention limits are always tracked for critical features?
With PDAP, automatic system responses link action management with process monitoring and automatically inform you of deviations in critical process and product characteristics.
Key Features
-
Statistical Process Control (SPC)
-
Test plan management / test order control
-
Shewhart-Control cards
-
5S method for evaluating the organization
Shewhart control cards
- Test for normal distribution
- Extensions for logarithmic normal distribution
- Median, single value, coefficient of variation, cusum and acceptance value charts
- Pre-Control Card
- Test report comparing the informative value of the different methods
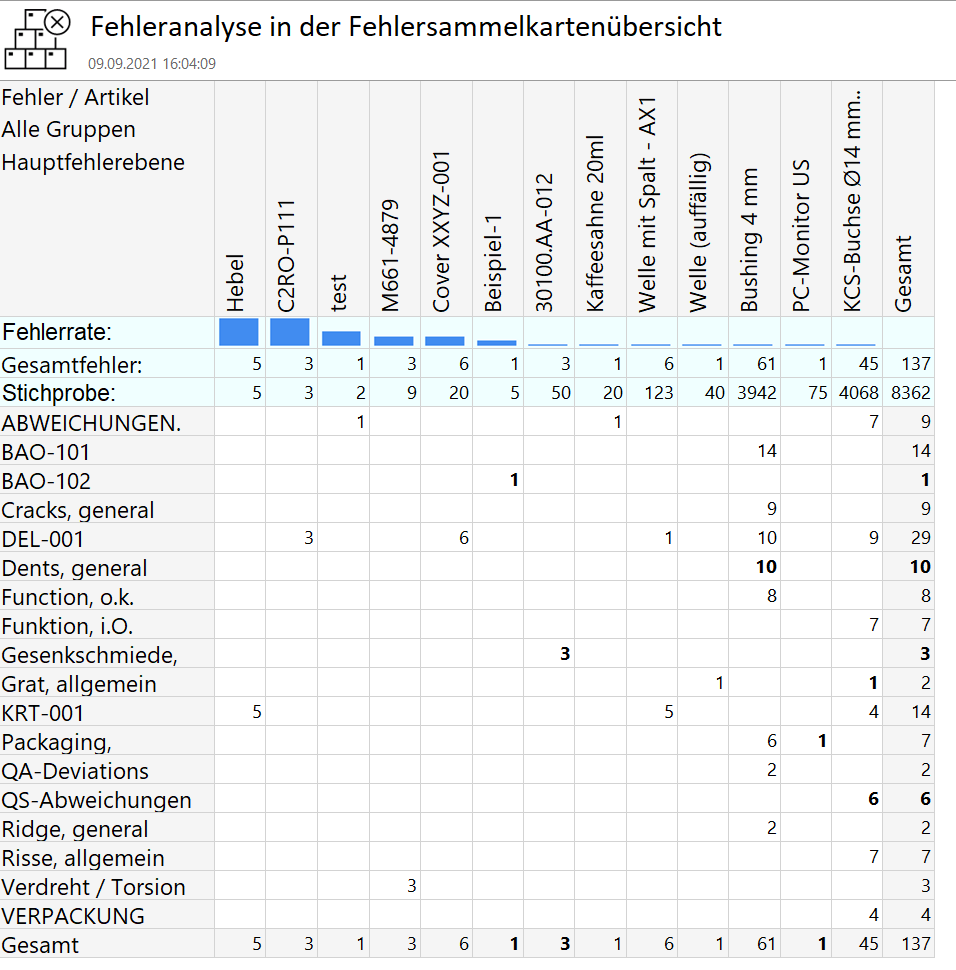
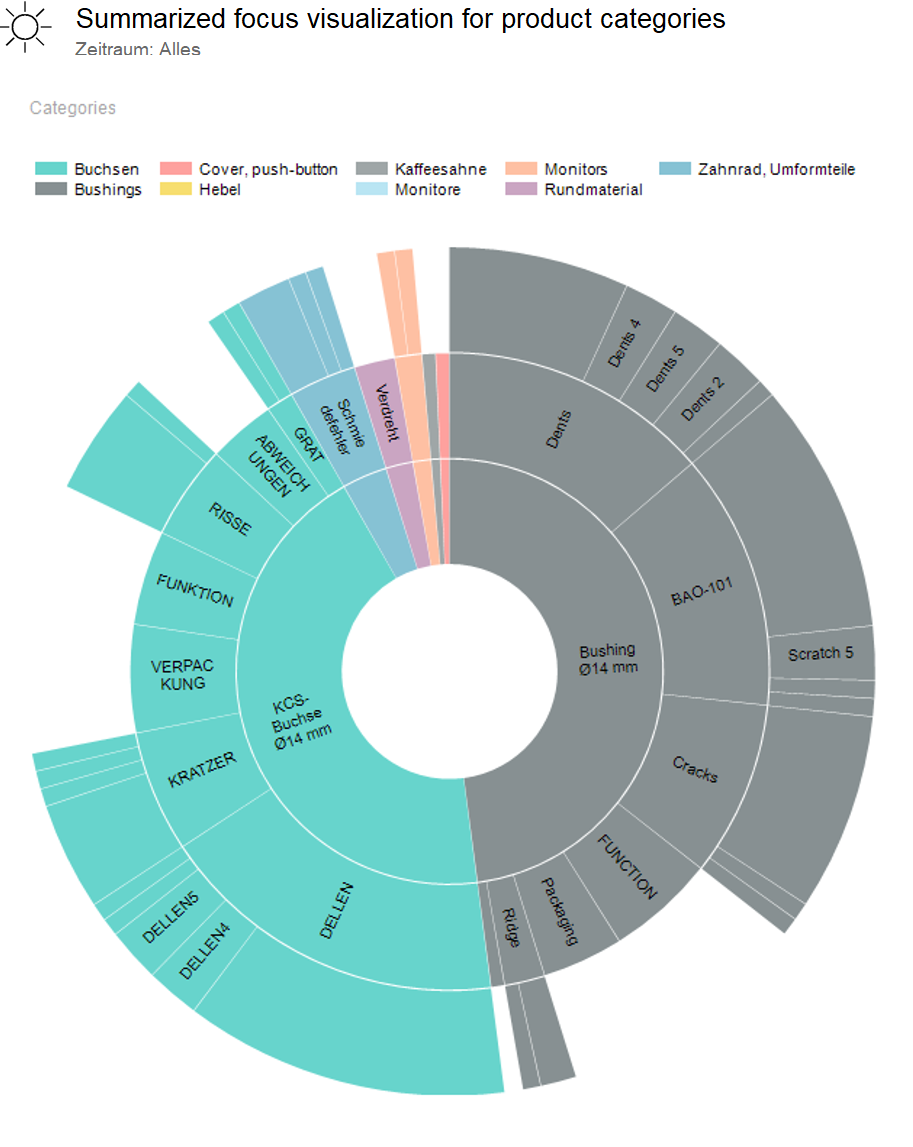
Attributive control charts
- u card -> number of errors
- p card -> number of faulty units
Highlights
Online SPC: The example of a machine interface enables integrated process control in practical use
Implementation of process improvement at the customer
The inspection data recording was largely integrated across all machines via an automatic log import. The majority of the characteristics flow into the CAQ database in automatically running orders. Finally, the inspectors check the orders as required and confirm them in a final characteristic by visual inspection. Automatic warning systems provide rule-based information about relevant deviations in production. In addition, a central online monitoring portal provides browser-based and continuous information about the current status of the key figures and the failure rate.


