Controlling with Business Intelligence
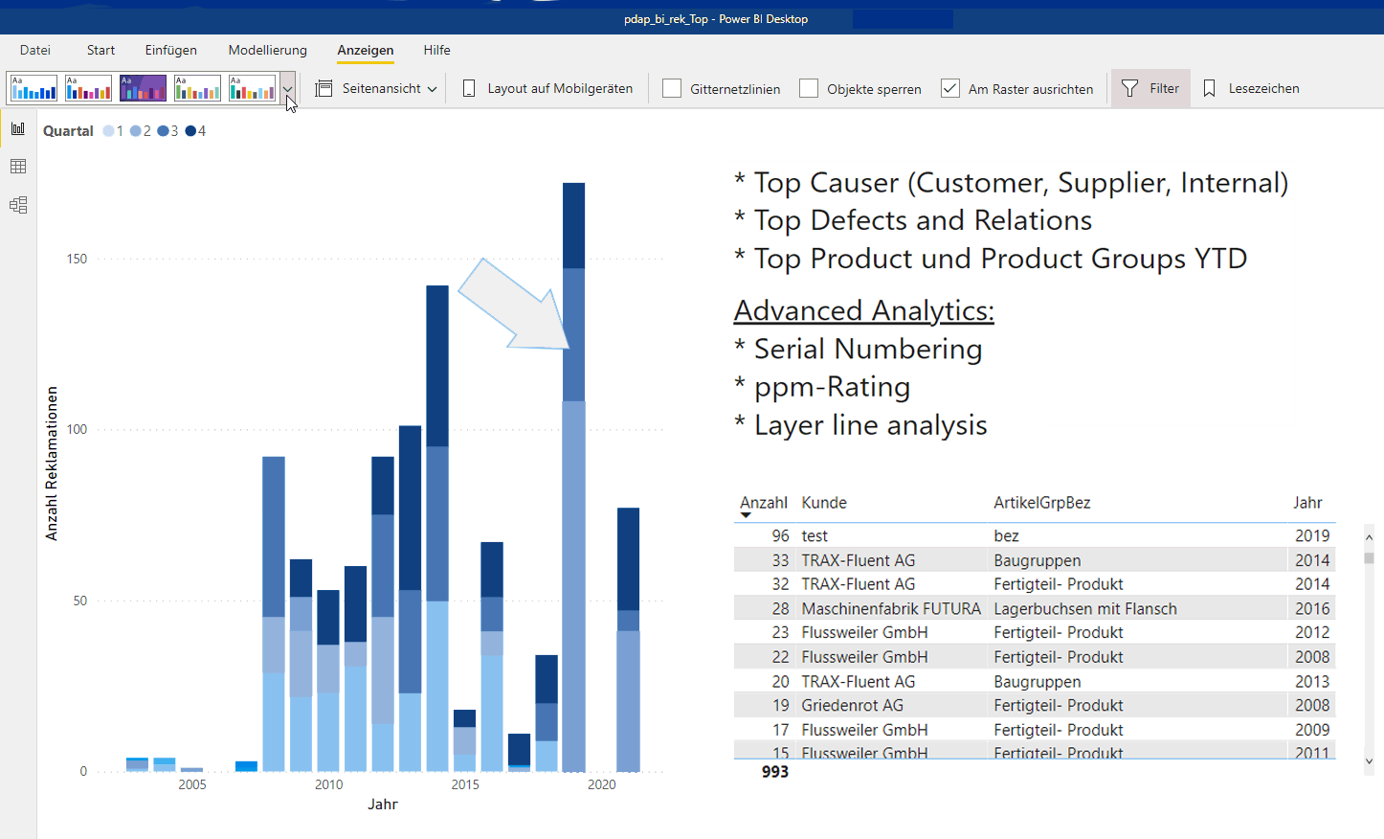
In this area, the relevant data is brought together and graphically prepared. This gives management and/or key users an up-to-date overview of their key figures. The basis for quick action is thus laid thanks to the data analysis. PDAP-BI (Business Intelligence) is based on Power BI from Microsoft and is the perfect tool for your controller. Use the standard or individualize the necessary areas with dashboards.
PDAP Management: View BI & Analytics
Interactive analyses and drilldown for controlling
Use visualizations of the interactive analyses for your controlling in order to evaluate and illustrate developments vividly. With PDAP 8, you get contextual, powerful visualizations that you can display with interactive self-service analytics via mobile devices.
-
Server-based enterprise reporting platform
-
Data models with Power BI and Excel for controlling
-
KPI and key figures as One Click / One Page views
-
Display on PC, browser or on mobile devices
Analysis tools
Recognize what is eating your profits
Use visualizations to clearly illustrate evaluations. In this way, you can recognize at an early stage who is nibbling away at your sales and which costs are eating you up.
With PDAP, you get contextual and powerful visualizations that you can use with interactive self-service analytics. For example, as you hover over the sharks in the animation, anonymized but real cost factors and their levels are visually illustrated to you. This is also possible with your company data.

